Netflix Movies and TV Shows (3) Netflix timeline
앞으로 4개의 캐글 노트북에 대한 글을 정리하려 합니다.
첫번째 캐글은 Netflix Movies and TV Shows 라는 데이터셋입니다. 개인적인 논리적 흐름을 고민하는 데 있어 Netflix Research에서 Analytics와 관련된 아티클을 공부했습니다. 필요하신 분들은 꼭 참고하시면 좋을 것 같습니다.
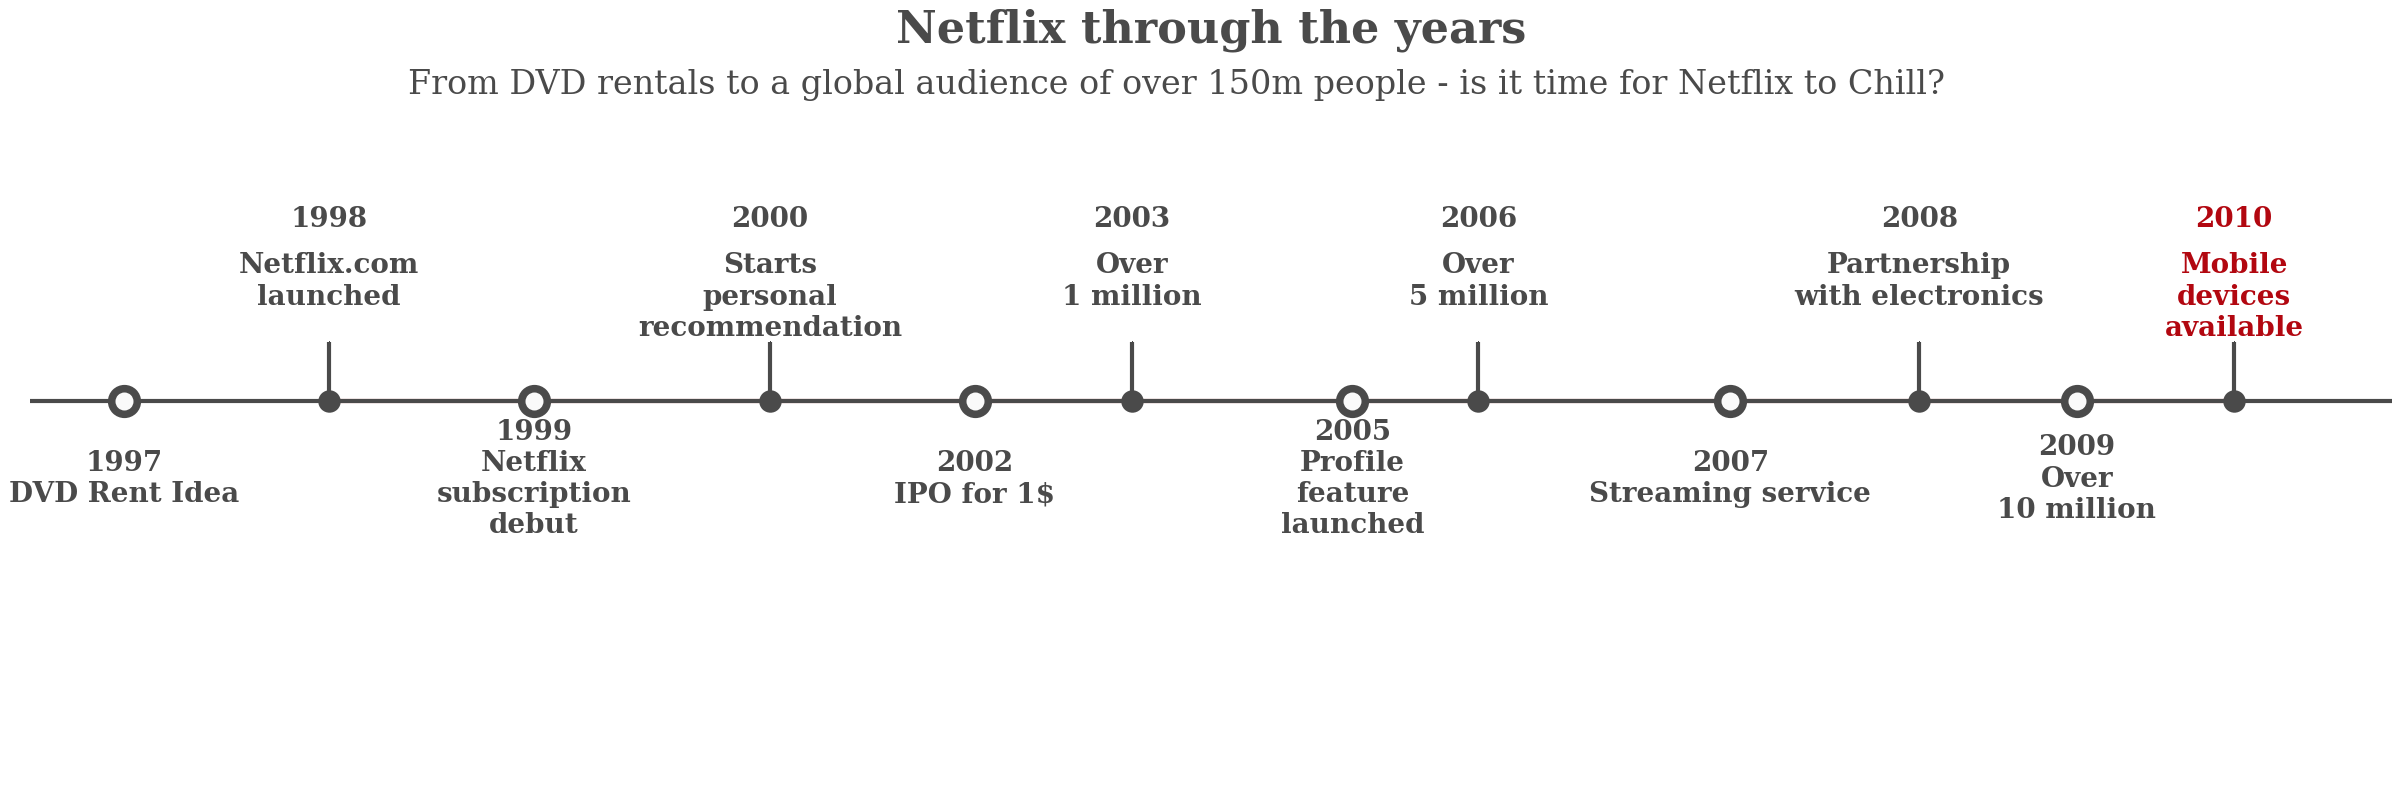
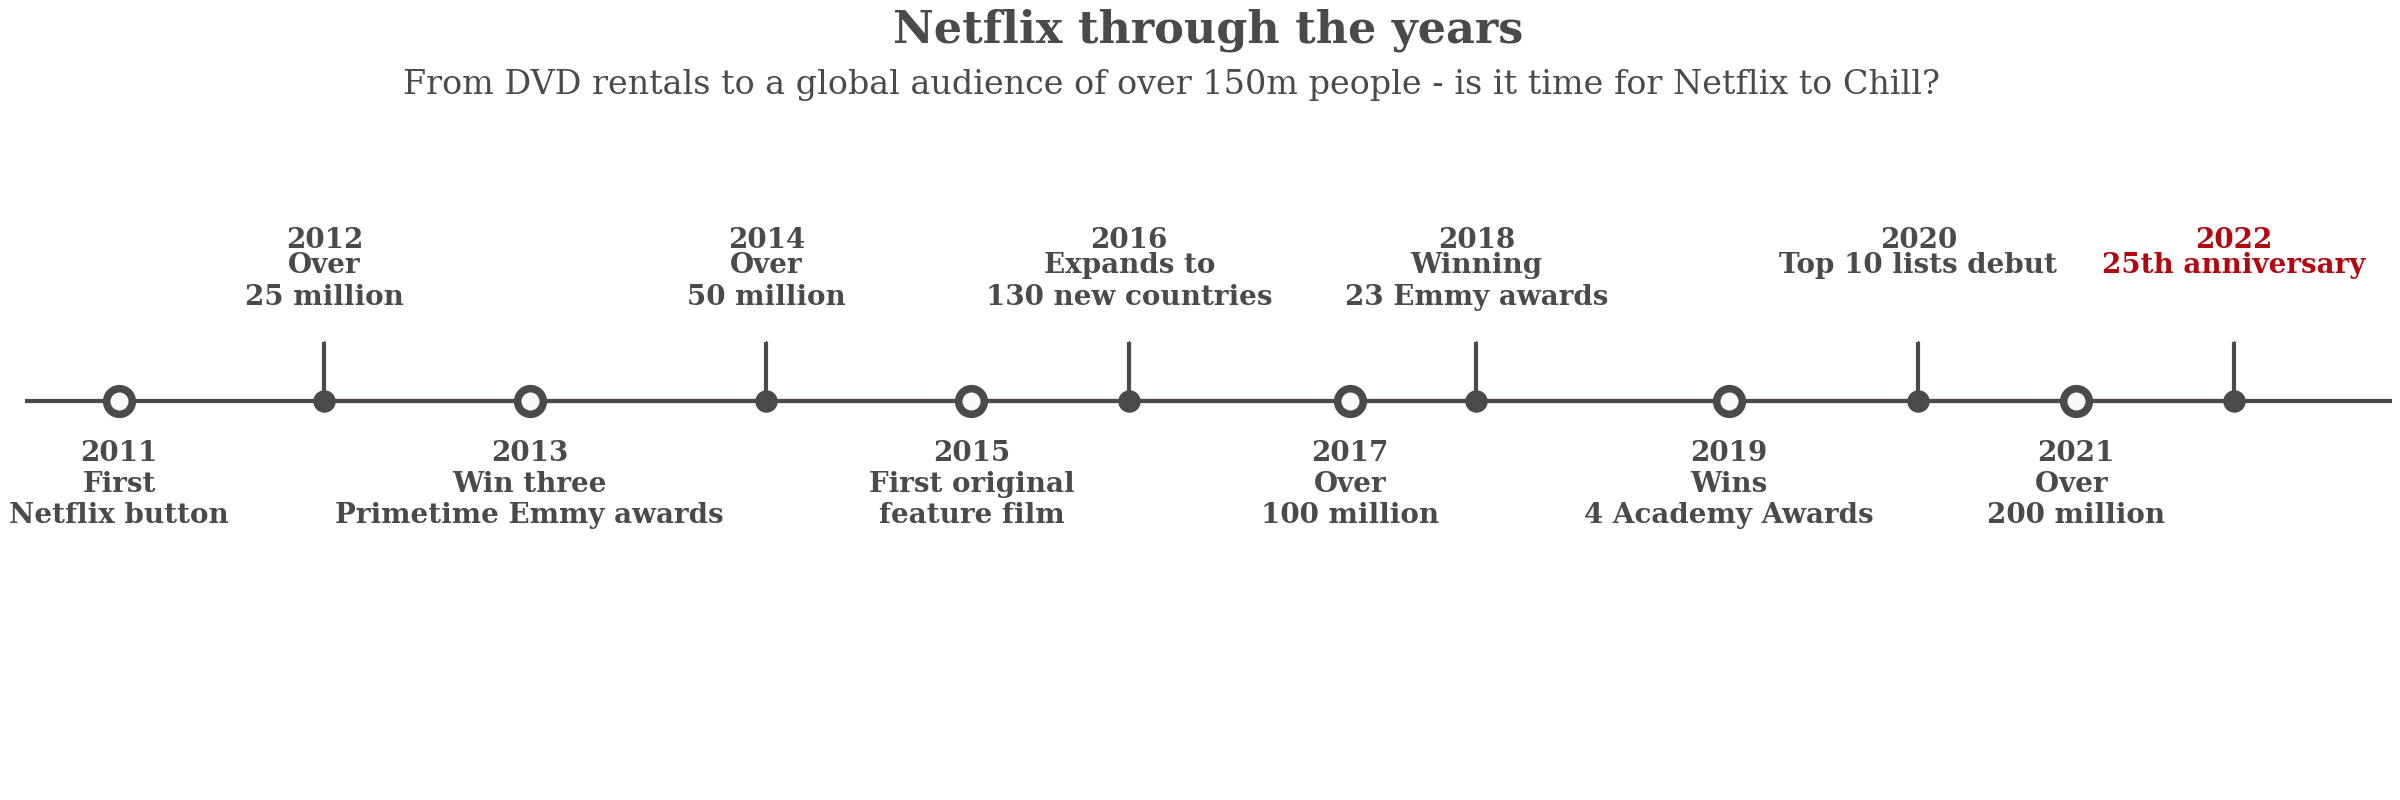
해당 그래프는 안수빈님의 notebook 과 Josh님의 notebook로부터
코드를 수정한 것입니다. 또한 해당 타임라인의 이벤트는 넷플릭스 공식 홈페이지를 참고하여 제작하였습니다.
이미지

코드
# Timeline code from Subin An's awesome notebook
# https://www.kaggle.com/subinium/awesome-visualization-with-titanic-dataset

from datetime import datetime

tl_dates = [
    "1997\nDVD Rent Idea",
    "1999\nNetflix\nsubscription\ndebut",
    "2002\nIPO for 1$",
    "2005\nProfile\nfeature\nlaunched",
    "2007\nStreaming service",
    "2009\nOver\n10 million"
]

tl_x = [0.6, 3.2, 6.0, 8.4, 10.8, 13]

tl_sub_x = [1.9, 4.7, 7.0, 9.2, 12, 14]

tl_sub_times = [
    "1998", "2000","2003", "2006", "2008", "2010"
]

tl_text = ["Netflix.com\nlaunched", "Starts\npersonal\nrecommendation","Over\n1 million","Over\n5 million","Partnership\nwith electronics",
    "Mobile\ndevices\navailable"
    ]

fig, ax = plt.subplots(figsize=(12, 4), constrained_layout=True)
ax.set_ylim(-2, 1.75)
ax.set_xlim(0, 15)

ax.axhline(0, xmin=0, c='#4a4a4a', zorder=1)

ax.scatter(tl_x, np.zeros(len(tl_x)), s=120, c='#4a4a4a',zorder=2)
ax.scatter(tl_x, np.zeros(len(tl_x)), s=30, c='#fafafa', zorder=3)

ax.scatter(tl_sub_x, np.zeros(len(tl_sub_x)), s=50, c='#4a4a4a', zorder=4)

for x, date in zip(tl_x, tl_dates):
    ax.text(x, -0.2, date, ha='center', fontfamily='serif', fontweight='bold', va = 'top',
            color='#4a4a4a',fontsize=10)

levels = np.zeros(len(tl_sub_x))
levels[::2] = 0.3
levels[1::2] = 0.3

markerline, stemline, baseline = ax.stem(tl_sub_x, levels, use_line_collection=True)
plt.setp(baseline, zorder=0)
plt.setp(markerline, marker=',', color='#4a4a4a')
plt.setp(stemline, color='#4a4a4a')

for idx, x, time, txt in zip(range(1, len(tl_sub_x)+1), tl_sub_x, tl_sub_times, tl_text):
    ax.text(x, 0.89, time, ha='center', va = 'top',
            fontfamily='serif', fontweight='bold',
            color='#4a4a4a' if idx!=len(tl_sub_x) else '#b20710', fontsize=10)

    ax.text(x, 0.76, txt, va='top',ha='center', fontweight='bold', fontsize=10,
            fontfamily='serif', color='#4a4a4a' if idx!=len(tl_sub_x) else '#b20710')

for spine in ['left', 'top', 'right', 'bottom']:
    ax.spines[spine].set_visible(False)

ax.set_xticks([])
ax.set_yticks([])
ax.set_facecolor('none')

ax.set_title('Netflix through the years', fontweight='bold', fontfamily='serif', fontsize=16, color='#4a4a4a')
ax.text(2.4, 1.57, "From DVD rentals to a global audience of over 150m people - is it time for Netflix to Chill?", fontfamily='serif',
        fontsize=12, color='#4a4a4a')

images_dir = '/content/drive/MyDrive/kaggle/Netflix Movies and TV Shows'
plt.savefig(f"{images_dir}/netflix_history1.png", dpi=200)
from google.colab import files
files.download(f"{images_dir}/netflix_history1.png")
이미지

코드
# Timeline code from Subin An's awesome notebook
# https://www.kaggle.com/subinium/awesome-visualization-with-titanic-dataset

from datetime import datetime

tl_dates = [
    "2011\nFirst\nNetflix button",
    "2013\nWin three\nPrimetime Emmy awards",
    "2015\nFirst original\nfeature film",
    "2017\nOver\n100 million",
    "2019\nWins\n4 Academy Awards",
    "2021\nOver \n200 million"
]

tl_x = [0.6, 3.2, 6.0, 8.4, 10.8, 13]

tl_sub_x = [1.9, 4.7, 7.0, 9.2, 12, 14]

tl_sub_times = [
    "2012", "2014","2016", "2018", "2020", "2022"
]

tl_text = ["Over\n25 million", "Over\n50 million","Expands to\n130 new countries","Winning\n23 Emmy awards","Top 10 lists debut",
    "25th anniversary"
    ]

fig, ax = plt.subplots(figsize=(12, 4), constrained_layout=True)
ax.set_ylim(-2, 1.75)
ax.set_xlim(0, 15)

ax.axhline(0, xmin=0, c='#4a4a4a', zorder=1)

ax.scatter(tl_x, np.zeros(len(tl_x)), s=120, c='#4a4a4a',zorder=2)
ax.scatter(tl_x, np.zeros(len(tl_x)), s=30, c='#fafafa', zorder=3)

ax.scatter(tl_sub_x, np.zeros(len(tl_sub_x)), s=50, c='#4a4a4a', zorder=4)

for x, date in zip(tl_x, tl_dates):
    ax.text(x, -0.2, date, ha='center', fontfamily='serif', fontweight='bold', va = 'top',
            color='#4a4a4a',fontsize=10)

levels = np.zeros(len(tl_sub_x))
levels[::2] = 0.3
levels[1::2] = 0.3

markerline, stemline, baseline = ax.stem(tl_sub_x, levels, use_line_collection=True)
plt.setp(baseline, zorder=0)
plt.setp(markerline, marker=',', color='#4a4a4a')
plt.setp(stemline, color='#4a4a4a')

for idx, x, time, txt in zip(range(1, len(tl_sub_x)+1), tl_sub_x, tl_sub_times, tl_text):
    ax.text(x, 0.89, time, ha='center', va = 'top',
            fontfamily='serif', fontweight='bold',
            color='#4a4a4a' if idx!=len(tl_sub_x) else '#b20710', fontsize=10)

    ax.text(x, 0.76, txt, va='top',ha='center', fontweight='bold', fontsize=10,
            fontfamily='serif', color='#4a4a4a' if idx!=len(tl_sub_x) else '#b20710')

for spine in ['left', 'top', 'right', 'bottom']:
    ax.spines[spine].set_visible(False)

ax.set_xticks([])
ax.set_yticks([])
ax.set_facecolor('none')

ax.set_title('Netflix through the years', fontweight='bold', fontfamily='serif', fontsize=16, color='#4a4a4a')
ax.text(2.4, 1.57, "From DVD rentals to a global audience of over 150m people - is it time for Netflix to Chill?", fontfamily='serif',
        fontsize=12, color='#4a4a4a')

# images_dir = '/content/drive/MyDrive/kaggle/Netflix Movies and TV Shows'
# plt.savefig(f"{images_dir}/netflix_history2.png", dpi=200)
# from google.colab import files
# files.download(f"{images_dir}/netflix_history2.png")
업로드 주소
해당 주피터 노트북은 여기에
지속적으로 업데이트 할 예정이니 전체 코드가 궁금하신 분들은 확인해주세요.
Just do it & Keep steady

댓글남기기